Avatar

Anabelle Laurent

Postdoctoral Research Scientist

Corteva Agriscience

Biography

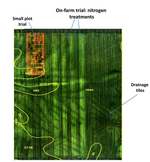
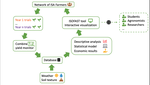
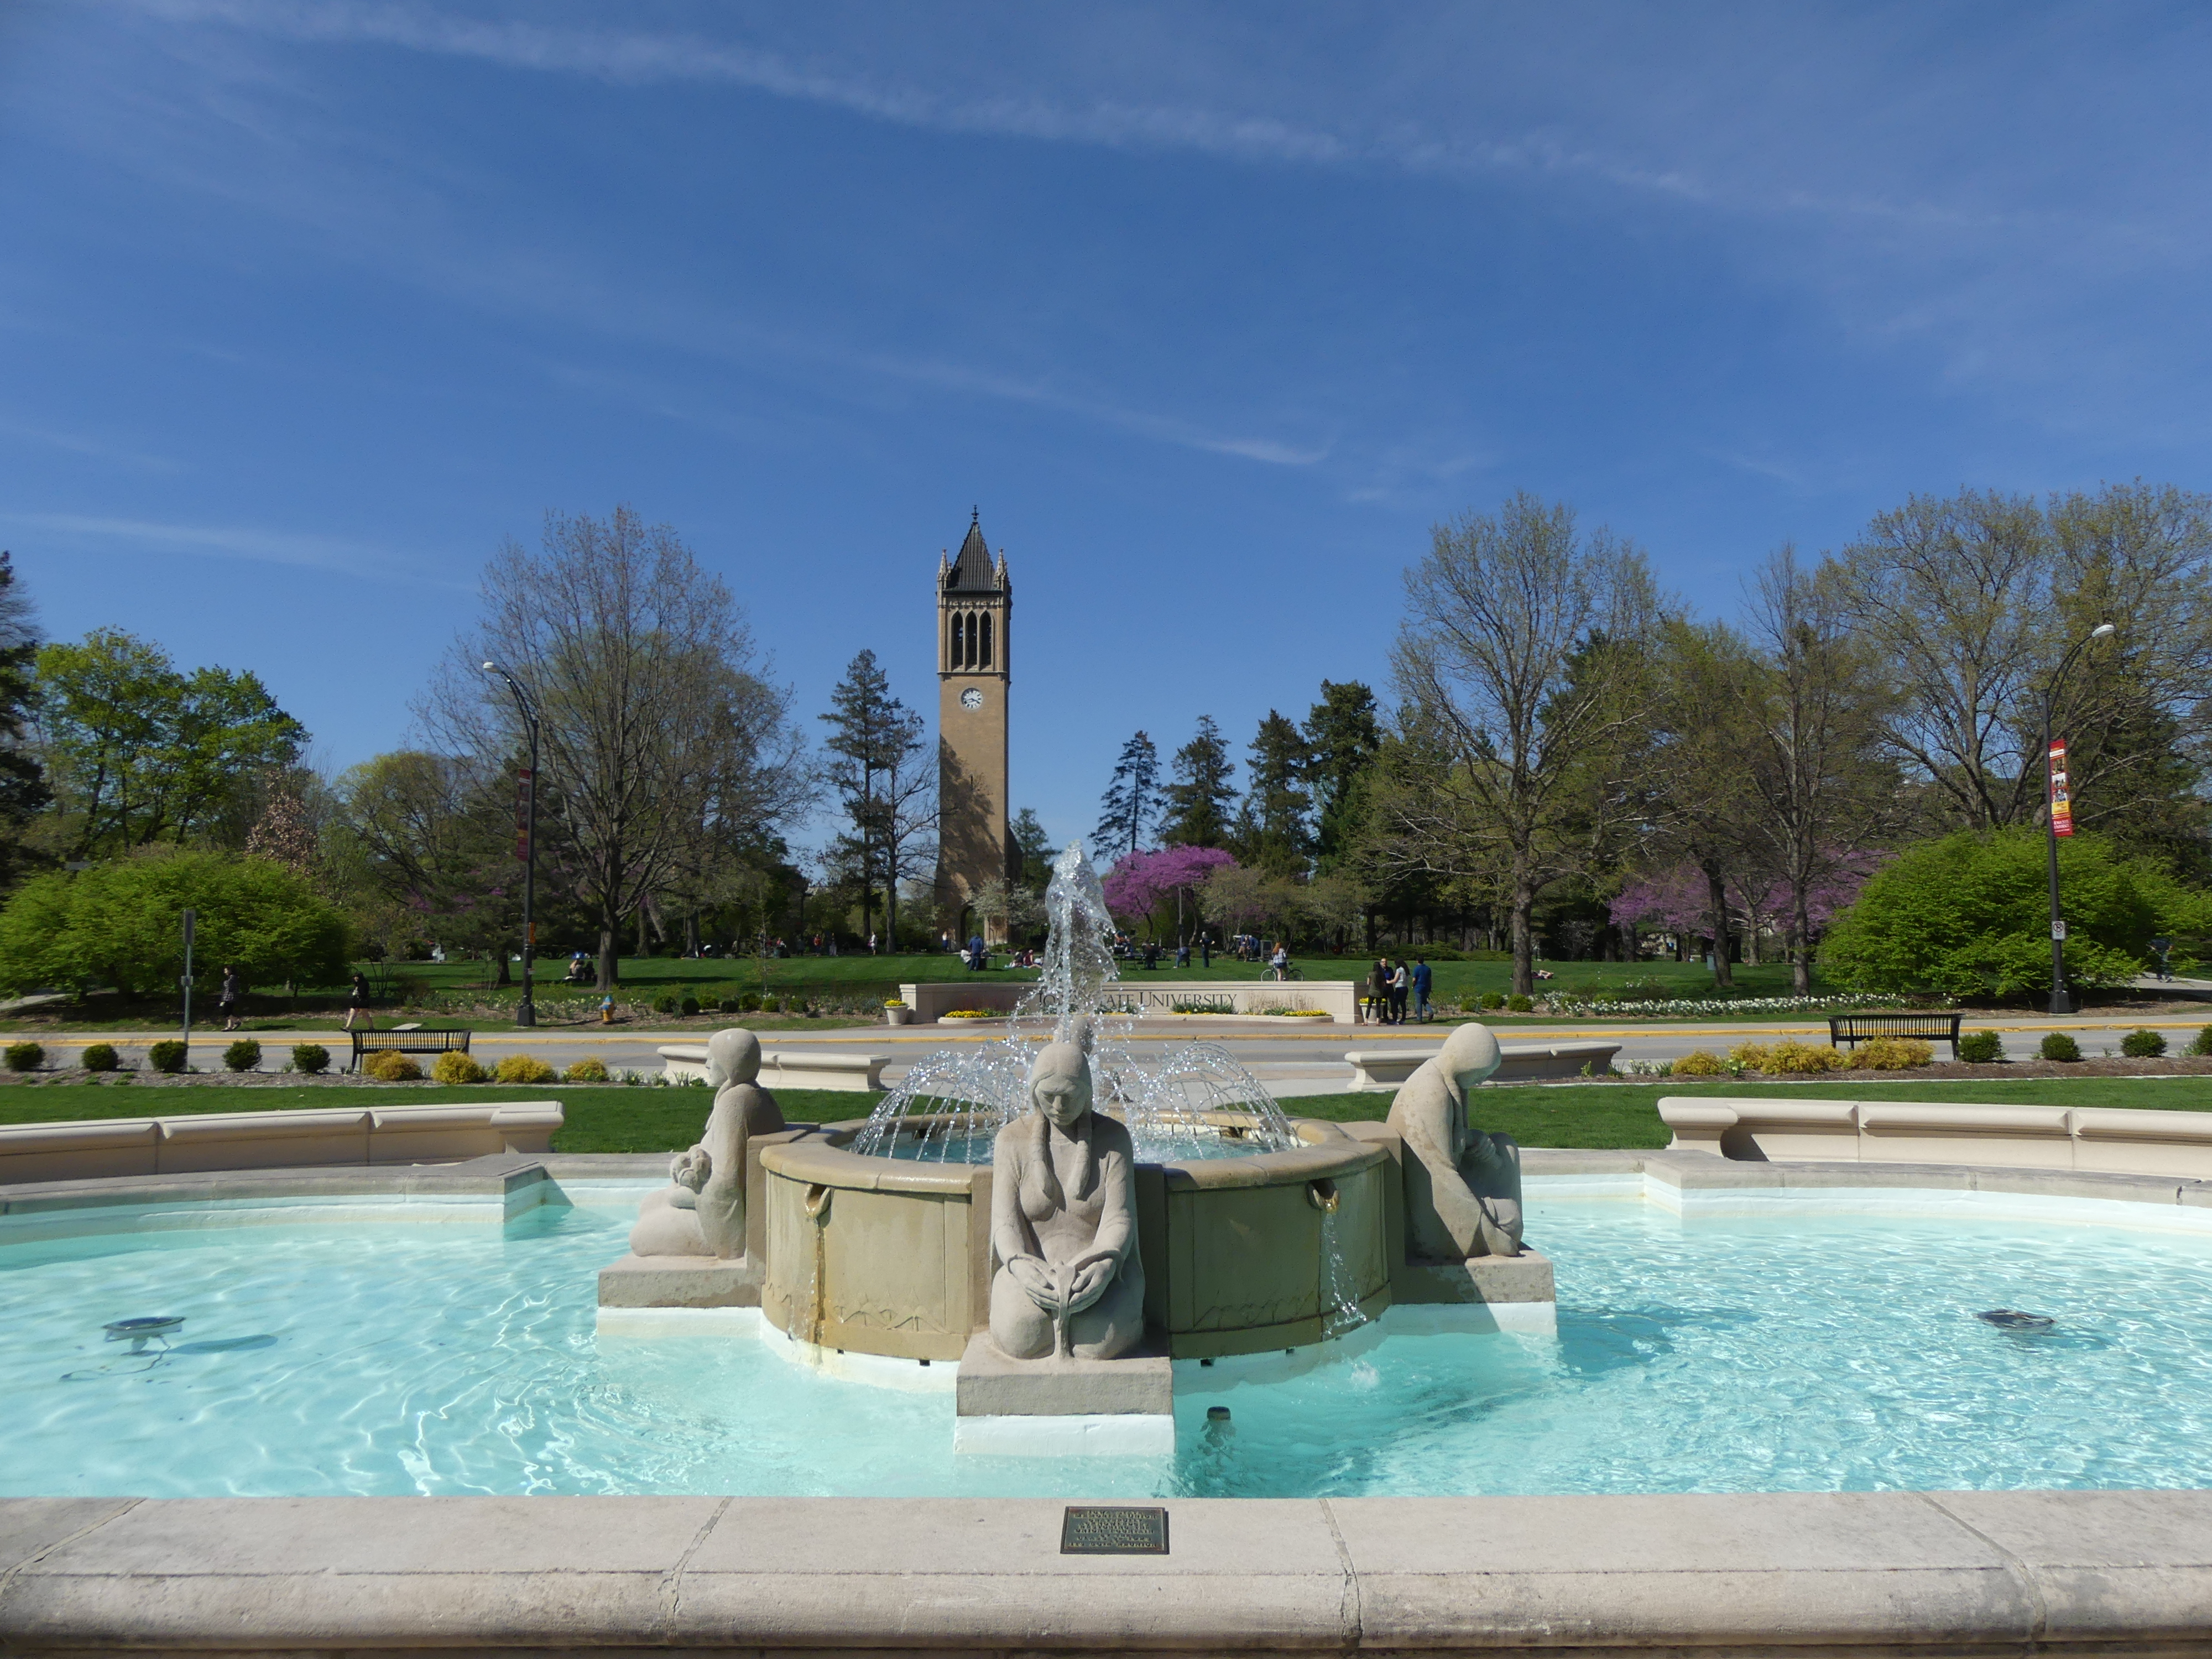
I am a postdoctoral research scientist in the biostatistics team of Corteva Agriscience. My research interests lie in the area of on-farm research, crop production and seed production. I enjoy combining statistical analysis and data visualization to make outcomes accessible to a broader audience. For my postdoc at Iowa State University, I worked on a project titled “FACT: WebBased Dynamic Data-Analytics Framework for OnFarm Research Networks”.

You can explore two web applications I developed with R Shiny by clicking here and here.

From 2019 to 2022 , I was co-leading R Ladies Ames with Xiaodan Lyu. Indeed, I like giving workshops and making tutorials about R coding.

In my spare time, I enjoy baking/cooking, spending time outdoors, and making craft.

Interests

  • Crop modeling
  • On-farm research
  • Data visualization
  • Experimental design

Education

  • PhD in Crop Production & Physiology, 2017 to 2020

    Iowa State University & INRA France

  • Master's Degree in sustainable agriculture, 2012

    Ecole Supérieure d'Agriculture (Angers, France)

Experience


Postdoctoral research scientist

Corteva Agriscience

Dec 2022 – Present Iowa
Responsibilities include:

  • Virtual phenotyping
  • Statistical consulting


Postdoc research associate

Iowa State University

Feb 2021 – Dec 2022 Iowa
Responsibilities include:

  • Crop modeling
  • Analyzing on-farm surveys data
  • Data visualization
  • Shiny web-app


PhD student

Iowa State University & INRA

Jan 2017 – Dec 2020 Iowa
Responsibilities include:

  • Crop modeling
  • Frequentist & Bayesian analysis
  • Data visualization


Research engineer

INRA UMR Agronomie

Jan 2013 – Dec 2016 France
Responsibilities include:

  • Meta analysis
  • Site-specific yield prediction
  • Monitored a network of agricultural trials
  • Cropping system design and ex-ante assessment

Recent & Upcoming Talks

Data Visualization Workshop

In this workshop, we will talk about Data Visualization as a support for communicating your findings. This workshop is not focus on programmation but students would have a chance to make plots using the R package Esquisse (no coding experience required) and build a Shiny user interface using the Designer R package.

Story telling with Data Visualization

Taller - Visualización de datos con R

En este taller, hablaremos sobre la visualización de datos. Se centra en la programación con R y especialmente el paquete ggplot2.

Taller - Manejo de datos con R

En este taller, hablaremos sobre el manejo de datos. Este taller se centra en la programación con R y especialmente el paquete dplyr.

Write a CV with R Pagedown

In this workshop, I will introduce some tips and tricks for building a CV with pagedown. This workshop is expected to be a hands-on workshop. Participants would have a chance to build their own “baby” resume.

Publications

Quickly discover relevant content by filtering publications.

Assessment of non-neonicotinoid treatments against aphids on sugar beets

Aphids can cause significant damage to sugar beet crops. Myzus persicae, also called green peach aphid, is responsible for transmitting …

A yield comparison between small-plot and on-farm foliar fungicide trials in soybean and maize

Agronomic research provides management recommendations based on small-plot trials (SPTs) and on-farm trials (OFTs) with very different …

On-farm trials reveal significant but uncertain control of botrytis cinerea by Aureobasidium pullulans and potassium bicarbonate in organic grapevines

Botrytis cinerea, a fungal pathogen that causes gray mold on grapes, can decrease yield, substantially reduce wine quality, and …

Interactive Web-based Data Visualization and Analysis Tool for Synthetizing on-farm Research Networks Data

The on-farm research network concept enables a group of farmers to test new agricultural management practices under local conditions …

Contact

  • 1203 Agronomy 716 Farm House Ln, Ames, IA 50011-1051